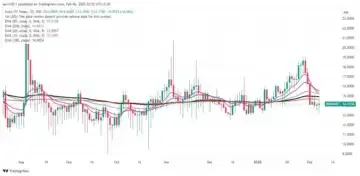
The Nifty 50 extended its weakness amid rangebound trading for another session on February 6, falling by four-tenths of a percent as traders remained cautious ahead of the RBI MPC (Monetary Policy Committee) meeting outcome due on February 7. As a result, consolidation cannot be ruled out in the upcoming session, though the overall trend remains positive.
In the case of a correction, the index may fall to 23,400-23,450 (near the 10 and 20-day EMAs), followed by 23,200, which is considered crucial support (where it negates the higher high-higher low formation). On the higher side, 23,800 is expected to be a crucial hurdle for the index, as above this level, 24,000 is the next key level to watch, experts said.
Here are 15 data points we have collated to help you spot profitable trades:
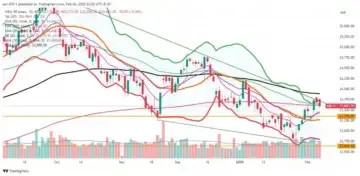
1) Key Levels For The Nifty 50 (23,603)
Resistance based on pivot points: 23,727, 23,779, and 23,862
Support based on pivot points: 23,561, 23,510, and 23,427
Special Formation: The Nifty 50 formed a bearish candlestick pattern on the daily charts with slightly above-average volumes, breaking below the 50 and 200-day EMAs (Exponential Moving Averages). However, it sustained above the short-term moving averages (10 and 20-day EMAs) as well as the midline of the Bollinger bands. On the weekly scale, the index formed a bullish candlestick pattern with an upper shadow, indicating some pressure at higher levels. However, it held the 50-week EMA at 23,430.
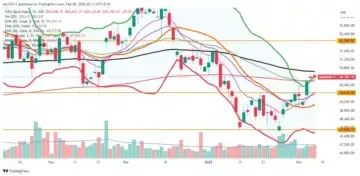
2) Key Levels For The Bank Nifty (50,382)
Resistance based on pivot points: 50,516, 50,611, and 50,765
Support based on pivot points: 50,208, 50,112, and 49,958
Resistance based on Fibonacci retracement: 51,153, 51,939
Support based on Fibonacci retracement: 47,875, 46,078
Special Formation: The Bank Nifty continued to outperform the Nifty 50 ahead of the RBI policy decision, ending 0.08 percent higher and forming a small bearish candle with a minor upper and long lower shadow on the daily timeframe. This suggested buying interest at lower levels, as the index still defended the 50 and 200-day EMAs on a closing basis and remained near the upper line of the Bollinger bands. The momentum indicators, with the RSI (Relative Strength Index) at 56.85, remained in the upper band, and the MACD (Moving Average Convergence Divergence) moved closer to the zero line.
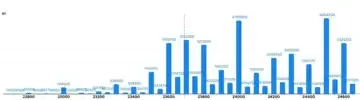
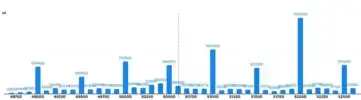
3) Nifty Call Options Data
According to the weekly options data, the 24,500 strike holds the maximum Call open interest (with 49.54 lakh contracts). This level can act as a key resistance for the Nifty in the short term. It was followed by the 24,000 strike (47.97 lakh contracts) and the 23,700 strike (35.22 lakh contracts).
Maximum Call writing was observed at the 24,500 strike, which saw an addition of 30.61 lakh contracts, followed by the 23,600 and 24,600 strikes, which added 26.98 lakh and 25.4 lakh contracts, respectively. The maximum Call unwinding was seen at the 23,250 strike which shed 1,950 contracts, followed by the 22,750 and 23,050 strikes which shed 525 and 75 contracts, respectively.
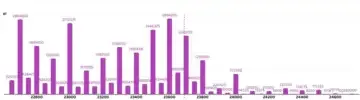
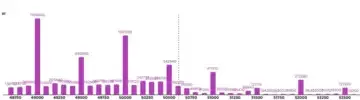
4) Nifty Put Options Data
On the Put side, the maximum Put open interest was seen at the 23,600 strike (with 28.94 lakh contracts), which can act as a key support level for the Nifty. It was followed by the 22,700 strike (28.54 lakh contracts) and the 23,000 strike (27.12 lakh contracts).
The maximum Put writing was placed at the 23,600 strike, which saw an addition of 18.22 lakh contracts, followed by the 22,700 and 23,700 strikes, which added 15.92 lakh and 10.62 lakh contracts, respectively. There was hardly any Put unwinding seen in the 22,650-24,700 strike band.
5) Bank Nifty Call Options Data
According to the monthly options data, the maximum Call open interest was seen at the 52,000 strike, with 17.8 lakh contracts. This can act as a key resistance level for the index in the short term. It was followed by the 51,000 strike (10.41 lakh contracts) and the 50,000 strike (7.57 lakh contracts).
Maximum Call writing was visible at the 50,500 strike (with the addition of 1.17 lakh contracts), followed by the 52,000 strike (1.15 lakh contracts) and the 51,000 strike (53,490 contracts). The maximum Call unwinding was seen at the 50,000 strike, which shed 45,990 contracts, followed by the 52,500 and 51,200 strikes, which shed 33,750 and 21,090 contracts, respectively.
6) Bank Nifty Put Options Data
On the Put side, the 49,000 strike holds the maximum Put open interest (with 13.9 lakh contracts), which can act as a key support level for the index. This was followed by the 50,000 strike (10.81 lakh contracts) and the 49,500 strike (6.82 lakh contracts).
The maximum Put writing was observed at the 50,500 strike (which added 1.17 lakh contracts), followed by the 50,000 strike (1.05 lakh contracts) and the 50,300 strike (96,480 contracts). The maximum Put unwinding was seen at the 49,400 strike, which shed 13,500 contracts, followed by the 49,600 and 51,400 strikes which shed 11,400 and 7,350 contracts, respectively.
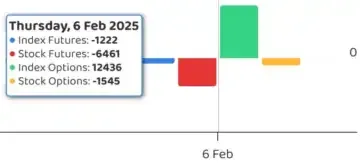
7) Funds Flow (Rs crore)
8) Put-Call Ratio
The Nifty Put-Call ratio (PCR), which indicates the mood of the market, fell to 0.95 on February 6, against 0.97 in the previous session.
The increasing PCR, or being higher than 0.7 or surpassing 1, means traders are selling more Put options than Call options, which generally indicates the firming up of a bullish sentiment in the market. If the ratio falls below 0.7 or moves towards 0.5, then it indicates selling in Calls is higher than selling in Puts, reflecting a bearish mood in the market.
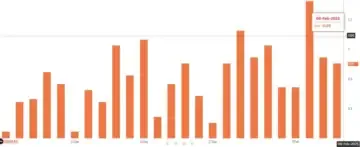
9) India VIX
The volatility index, India VIX, which measures expected market volatility, remained in the lower zone and below all key moving averages. However, it closed 0.66 percent higher at the 14.18 level, still maintaining comfort for the bulls.
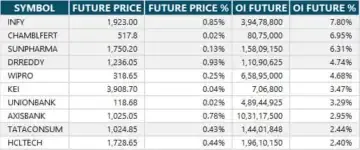
10) Long Build-up (27 Stocks)
A long build-up was seen in 27 stocks. An increase in open interest (OI) and price indicates a build-up of long positions.
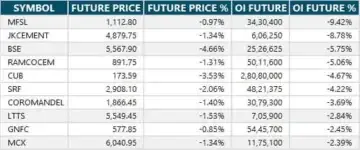
11) Long Unwinding (50 Stocks)
50 stocks saw a decline in open interest (OI) along with a fall in price, indicating long unwinding.
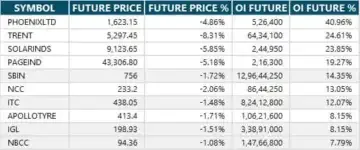
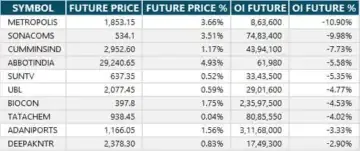
12) Short Build-up (122 Stocks)
122 stocks saw an increase in OI along with a fall in price, indicating a build-up of short positions.
13) Short-Covering (32 Stocks)
32 stocks saw short-covering, meaning a decrease in OI, along with a price increase.
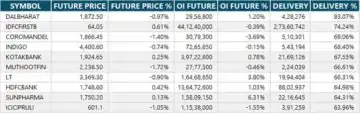
14) High Delivery Trades
Here are the stocks that saw a high share of delivery trades. A high share of delivery reflects investing (as opposed to trading) interest in a stock.
15) Stocks Under F&O Ban
Securities banned under the F&O segment include companies where derivative contracts cross 95 percent of the market-wide position limit.
Stocks added to F&O ban: Nil
Stocks retained in F&O ban: Nil
Stocks removed from F&O ban: Nil
Disclaimer: The views and investment tips expressed by experts on Moneycontrol are their own and not those of the website or its management. Moneycontrol advises users to check with certified experts before taking any investment decisions.